Future-proofing Buildings in New York City
|
The Future of Emissions & Energy
The future of greenhouse gas emissions is clear: efforts will continue to reduce and ultimately eliminate all of them. The future of electricity and energy is less certain. It's impossible to argue that reducing the amount of man-made greenhouse gases released into the atmosphere is anything but good. However, as with anything new, there are bound be challenges along the road to decarbonization. The questions critical to building owners, businesses and residents regarding that reduction are how much, how fast and at what cost? How Much & How Fast New York State's CLCPA calls for 100% clean, renewable energy statewide by 2050. Similarly, OneNYC 2050 calls for an all-electric New York City by 2050. This means changing the way homes and buildings are heated and cooled, the way we heat water and cook, the way our electricity is produced, the way we power our vehicles...changing virtually everything. Every non-electric device, system or process that requires energy will have to be converted to electricity, replaced by electric equivalents or eliminated:
In the past, governments were concerned about the costs of energy and electricity since these directly impact the cost of living and the cost of doing business. High energy prices tended to deter the inflow of people and businesses and inhibited growth. Today, however, the focus is on reducing greenhouse gas emissions and energy consumption, and cost is secondary. One need no other example of this fact than LL97 or the Climate Mobilization Act that aims to levy substantial fines on any building owner not is compliance with increasingly stringent emissions requirements. We attempt to explain what the future of changes to New York’s energy and electricity will look like and how it might impact building and business owners using the following four figures showing:
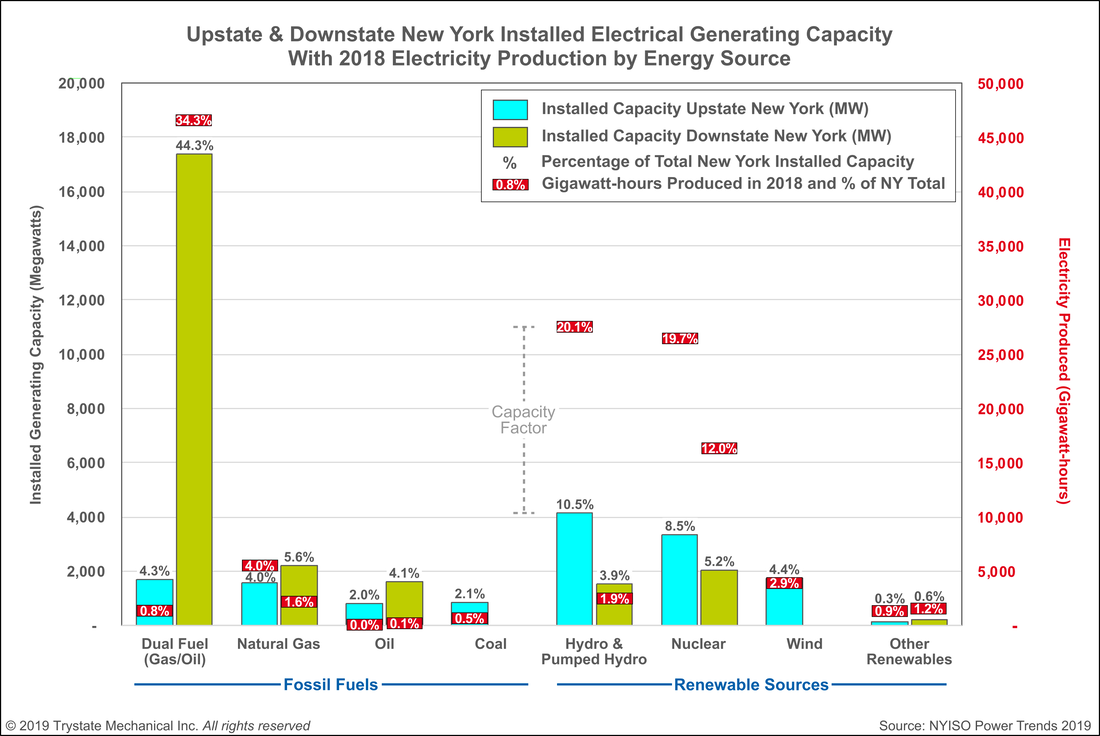
Figure 1. New York Installed Generating Capacity and Electrical Production in 2018
Figure 1 is an overview of New York's 2018 electrical generating capacity and energy production situation. The vertical bars represent the 2018 installed generating capacity (MW) for each source and the percentage of all installed capacity. The red rectangles show how much electricity was generated by each source and the percentage of total generation for 2018. For example, upstate nuclear represents 8.5% of the installed capacity, however it produced nearly 20% of all electricity in 2018. A few salient points about Figure 1 include:
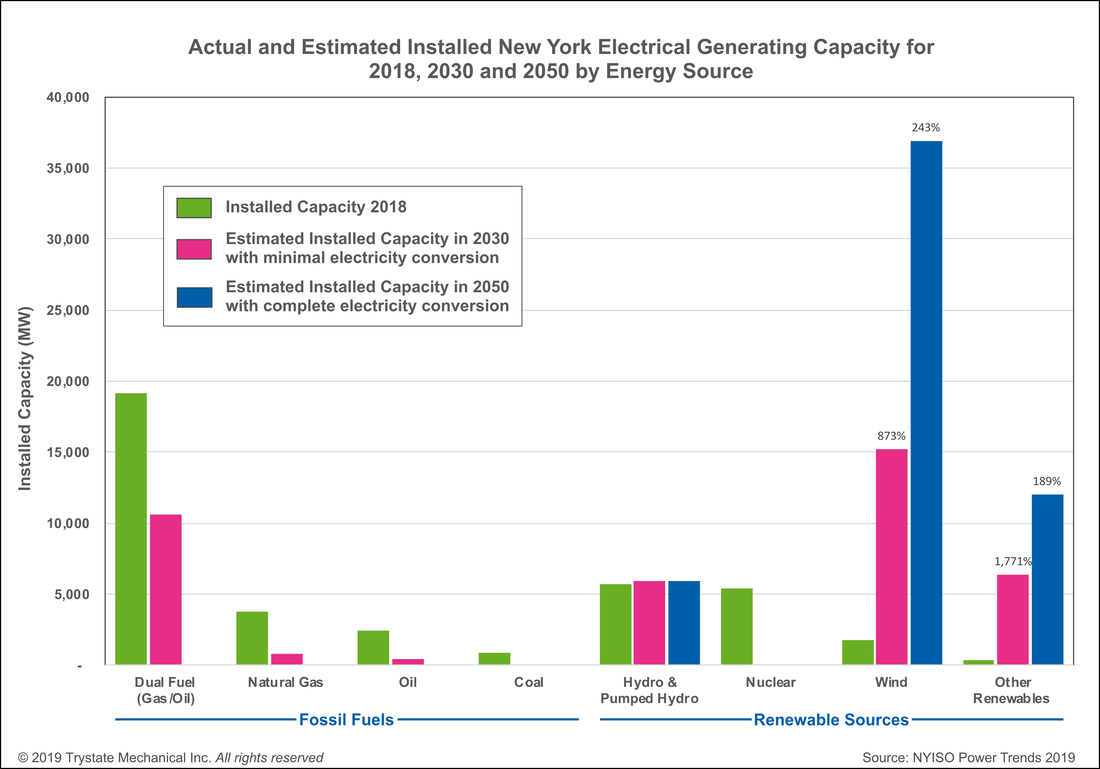
Figure 2. Actual and Estimated Installed Generating Capacity 2018 - 2030 - 2050
Figure 2 shows the 2018 installed electrical generating capacity in the State along with estimates of what that capacity might look like in 2030 and 2050 based on the CLCPA and OneNYC 2050.
The 2030 estimate addresses the CLCPA requirement that 70% of all electricity consumed in the State come from “clean” sources and assumes: 1) all nuclear capacity is decommissioned by 2030 and 2) the conversion of fossil fuel-using processes (i.e. heating, transportation, etc.) to electricity is still relatively small. For 2050, both the CLCPA and OneNYC 2050 envision no fossil fuel usage, hence all fossil generating capacity is nil. Moreover, by 2050, all former fossil generation must be replaced by wind and other renewable generation. In this case, all estimated natural gas, gasoline, diesel and fuel oil consumption must be converted to "clean" electrical generating capacity. The figure shows that wind generating capacity must be increased by over 800% to achieve the 2030 targets and the 2030 level must be increased by more than 240% to reach the 2050 level. 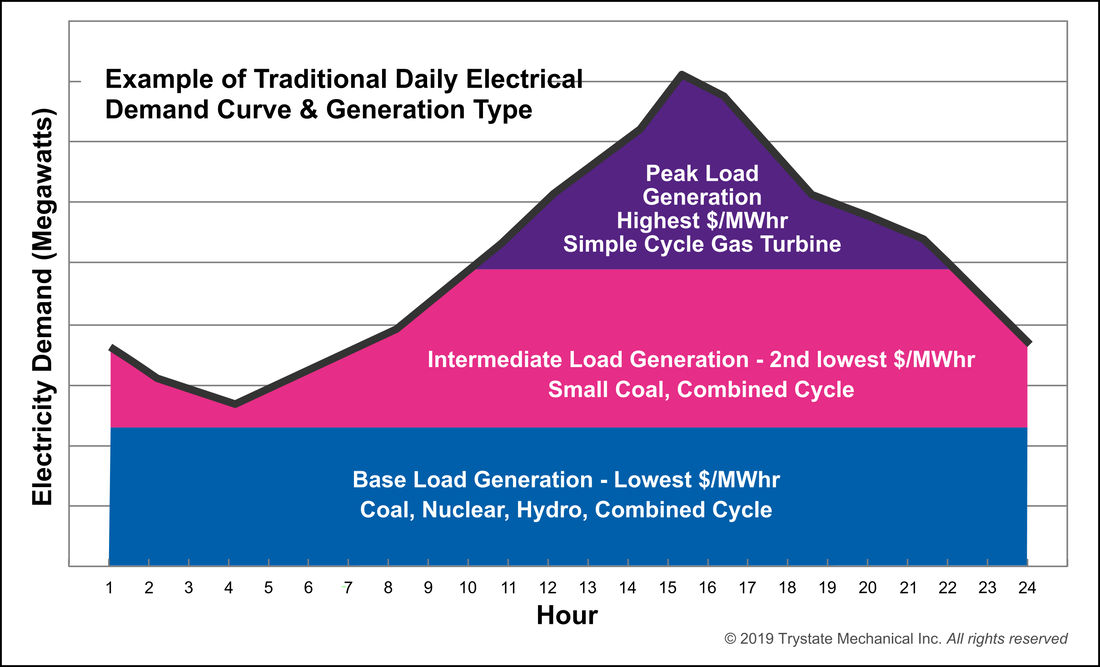
Figure 3a. Typical Daily Electrical Demand Curve
Figure 3a shows a traditional electrical demand curve that follows a very predictable pattern: ramping up through the day and reaching its peak in the afternoon and falling off overnight. The figure also shows how different types of conventional generation was “stacked” to achieve the lowest costs for consumers while ensuring a reliable supply.
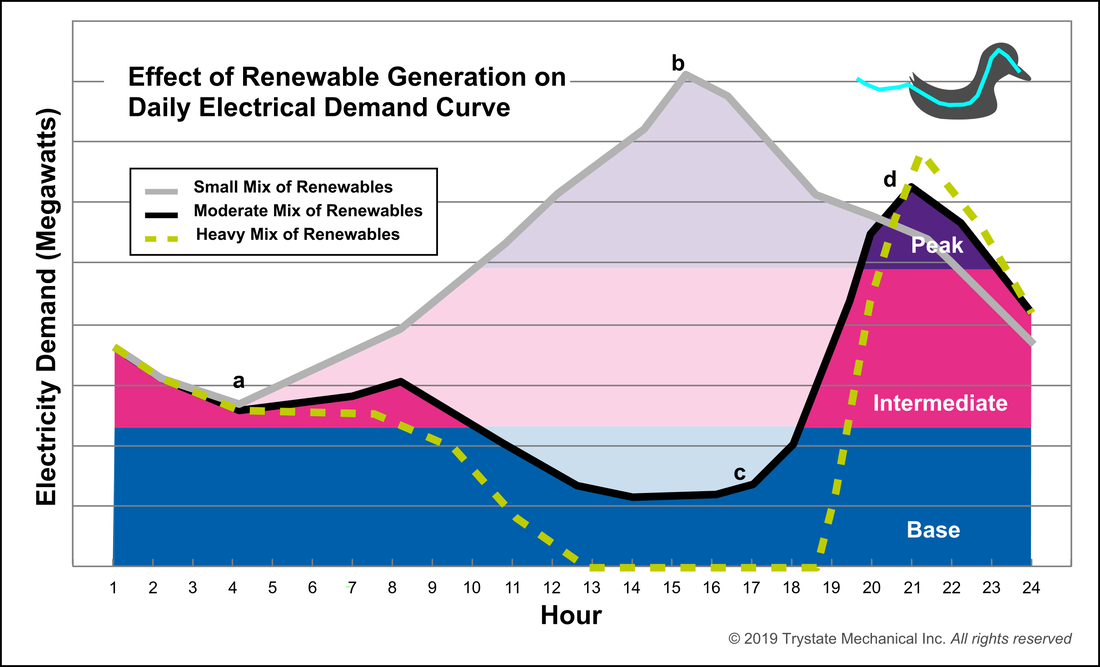
Figure 3b. "Duck curve" - Effect of Renewables on Daily Electrical Demand
Figure 3b shows what is called a “duck curve” due to the shape of the demand curve resembling the silhouette of a duck. With a small number of renewables, the demand curve remains largely unchanged. As the amount of renewable generation grows, it starts to displace increasingly larger shares of peaking, intermediate and baseload generation...but, only when it operates. This displacement skews generating costs since much of the conventional generation is no longer operated at optimum efficiency yet it must remain operational to backup renewable generation when the wind doesn’t blow or the sun doesn’t shine. However, there are even more problems in the duck’s neck.
Compare the slope of the lines made by the points “a-b” and “c-d”. The two lines rise about the same amount, but the c-d line has a much steeper slope than the a-b line. This shows how conventional generation output must be ramped up much more quickly (e.g. c-d) and then abruptly ramped down. Most large conventional fossil baseload and intermediate generating plants ramp up their electrical outputs relatively slowly to minimize thermal “shock” to the equipment (e.g. slope a-b). In comparison, fossil peaking plants that are designed to start and stop quickly (e.g. slope c-d). "Peakers", however, tend have poor efficiency and high operating and maintenance costs. As the percentage of renewables increases, more peaking-type units will be used as backup generating capacity which will increase generating costs and grid complexity until utility-scale energy storage costs come down. The speed, scale and costs of completely changing the energy and electricity landscape in New York represent meaningful risks to building and business owners. These risks include dramatically higher energy and electricity prices, electric supply (grid) interruptions, increased incidence of electric power quality problems and electrical resiliency in the event of natural or man-made disaster. |
Future-proofing Buildings
Future-proofing buildings or businesses from the uncertainties of emissions and energy policies and plans starts with understanding the risks posed by these uncertainties. Risk of Emissions Uncertainties Both New York City and State have emissions-reductions policies that will soon become effective, but both policies contain numerous regulations that are “to-be-determined” or contain caveats that make their implementation unclear. Both policies also solidly link emissions to energy and electricity usage. Even under the City’s Climate Mobilization Act that fines building owners for excess emissions, those emissions are calculated based on energy and electricity usage. This means that energy and electricity are the primary starting points for futureproofing for emissions uncertainties. Risk of Energy & Electricity Uncertainties Building and business owners have a fair degree of control and discretion over the type and amount of energy and electricity they consume. What they have little to no control over are the costs and quality of the energy and electricity they purchase. 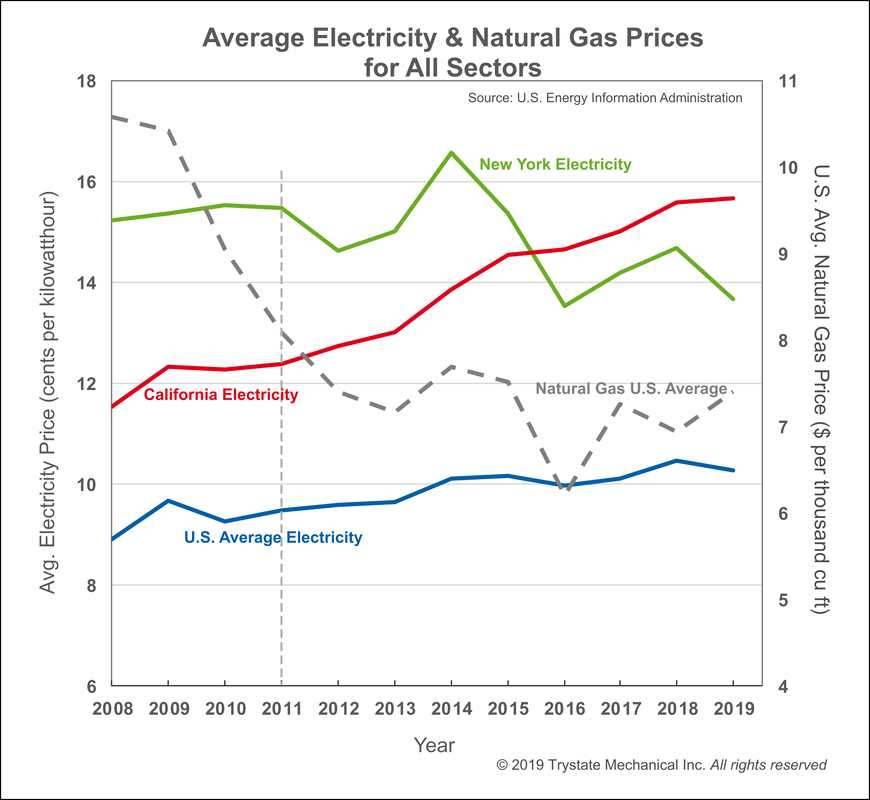
Figure A. Average Electricity & Natural Gas Prices
The cost of energy, in the form of fossil fuels such as natural gas, gasoline, fuel oil, etc., has been kept relatively inexpensive today thanks to the abundant supply of natural gas. Figure A shows how electricity prices in New York dropped along with natural gas prices. What can also be seen in Figure A is the way that California electricity prices seem relatively unaffected by the substantial drop in natural gas prices. One of the reasons for this is California’s aggressive addition of renewable generation which started around 2011. New York’s emissions and energy policies are set to follow the same model as California.
In addition to cost, quality is also a risk for building and business owners. The quality of fossil fuels rarely changes since it is tightly controlled by specification. The same is not true for electricity. While the general tolerance for the supply of electricity is the nominal voltage plus or minus five percent (+/-5%), it only applies to steady state as described in ANSI C84.1: “These limits shall apply to sustained voltage levels and not to momentary voltage excursions that may occur from such causes as switching operations, fault clearing, motor starting currents, and the like.” This gets utilities “off-the-hook” so to speak when voltage sags and surges, low voltage, blackouts similar problems occur. Various studies put the cost of power quality problems for U.S. businesses between $100 and $200 billion dollars per year. 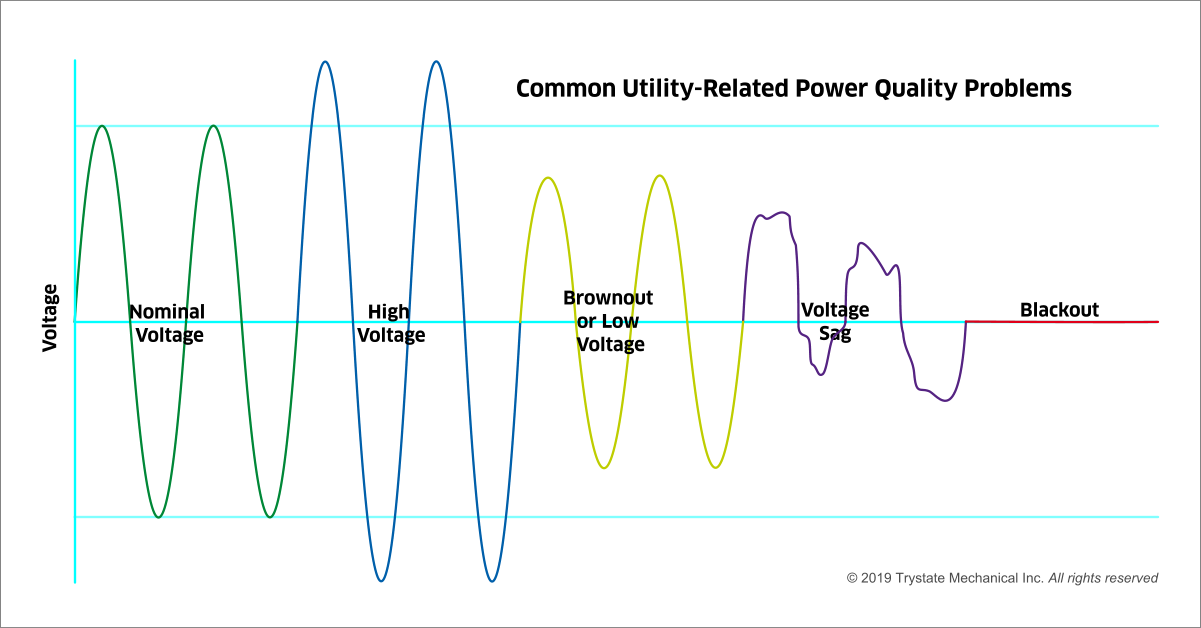
Figure B. Common Power Quality Problems
As the cost and quality of electricity takes a back seat to environmental issues and politics, the risk to building and business owners increases. This is compounded by major changes in electricity markets, electric utility business models and future local and national regulations.
Future-proofing Buildings & Businesses Ultimately, future-proofing a building or business means reducing energy and electricity consumption to minimize emissions and costs. It also means protecting the building or business against external risks such as large energy or electricity price increases, shortages or quality problems. 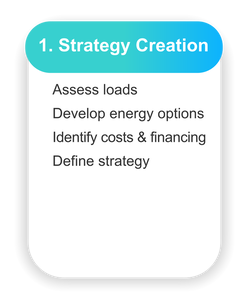
The first step is developing an integrated energy strategy. This entails assessing load energy and electricity profiles including levels of consumption and demand, timing (hourly, daily, seasonal, etc.), criticality, association with other loads, etc. With load profiles in hand, the next step is considering all energy options for serving the loads including electrification, waste heat capture and load shifting and considering all of the possible cost and financing options. This is the point the integrated strategy can be created, most likely with the assistance of an energy integrator.
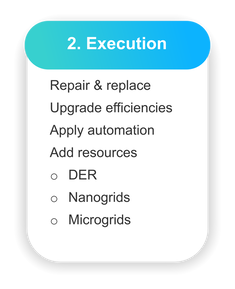
The next step is the execution of the strategy. This may include efficiency measures, existing building commissioning, building automation combining energy, management and security all of which are meant to reduce energy and electricity consumption. Distributed Energy Resources, nanogrids and microgrids may include combined heat & power, wind or solar, thermal or electrical energy storage. These resources not only increase efficiency, but many serve to provide protection against power quality problems as well as operate independently from the grid for protection from blackouts and long-term outage situations.
Lastly, future-proofing requires optimizing energy-producing resources to maximize potential revenue from energy or electricity sales as well as monitoring, maintaining and managing all systems in sufficient detail to keep everything running at peak efficiency and lowest cost.
|
